Analysis: Mining for Economic Gold
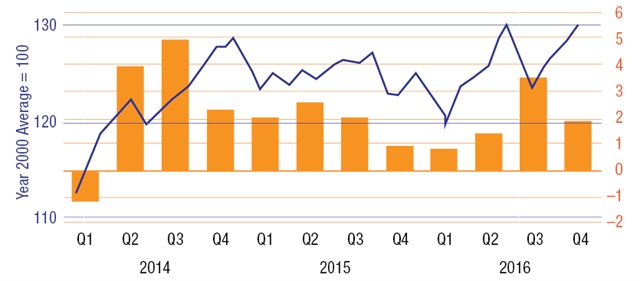
This graph shows the comparative performance of the Transportation Services Index (blue) and Gross Domestic Product (orange) over each quarter in the last three years.
“>
This graph shows the comparative performance of the Transportation Services Index (blue) and Gross Domestic Product (orange) over each quarter in the last three years.
“>
Every once in a while, there are largely overlooked nuggets of information buried in the numbers about the economy and trucking that could be the most telling sign of where conditions are headed. Some of those recent nuggets make it almost impossible not to reasonably hope this year will be a good one.
U.S. for-hire freight movements – including trucking, rail, inland waterways, pipelines and air freight – were up during the fourth quarter of 2016 by 2.9% from the third quarter. It’s a perfect example of how the health of trucking is tied to the overall economy.
This increase in for-hire shipments took place as growth in the gross domestic product – the widest measure of economic activity – slowed to an annual rate of 1.9% in the fourth quarter, down from 3.5% in the third quarter, in the first of three estimates released in late January.
The fourth quarter slowdown in GDP growth was preceded by a third-quarter dip in for-hire freight movement of 1.1%. And the rapid GDP growth in the third quarter was preceded by a strong increase in freight movements in the second quarter of 2.5%.
In other words, when for-hire freight movements are good in any given quarter, like they were in the final quarter of 2016, it helps set the stage for improvements in the GDP for the following quarter, in this case, the first quarter of 2017.
When you consider the fourth-quarter increase in for-hire freight movements was the largest gain since the final quarter of 2011, that’s reason for optimism for first-quarter GDP numbers.
Going the other way, however, GDP doesn’t always tell the whole story when it comes to trucking. Take imports. …Read the rest of this story
