PIT Group to Hold its First U.S. Fuel Economy Trials

PIT Group to Hold its First U.S. Fuel Economy Trials

<img width="150" src="http://www.automotive-fleet.com/fc_images/news/m-pit-test-1.jpg" border="0" alt="

Photo: PIT Group

">

Photo: PIT Group

">

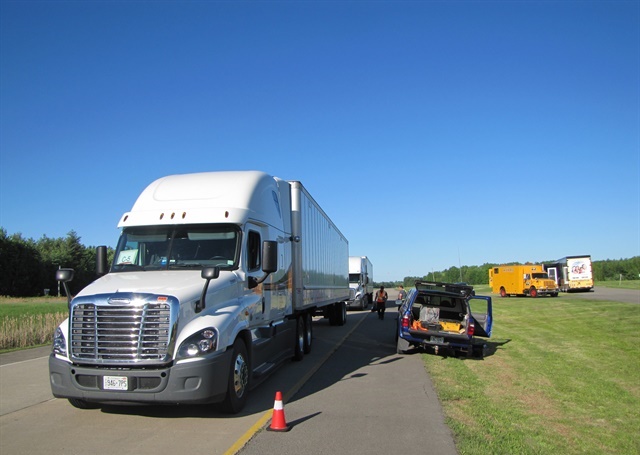
Montreal-based research and engineering firm PIT Group has announced it will hold its first set of Energotest fuel-economy trials in the U.S. at Uvalde, Tex., from Feb. 13-17, 2017.

The Energotest will be held at Continental Truck Tires Uvalde' Proving Grounds and will showcase the company's ability to provide accurate performance fuel-economy data to fleets and technology providers.

Each Energotest event gives transportation companies the ability to take part in a road testing laboratory experience, according to PIT. The firm then uses the data it gains to evaluate the economic and environmental impact of green technologies.

"This first Energotest in the U.S. will showcase the credibility of our team of highly qualified experts by providing accurate, verified data on the performance of technologies for fleets and technology providers in the U.S.," said PIT Group Manager Yves Provencher. "Thanks to a thorough process using cutting-edge equipment, Energotest will help fleets rest assured they are obtaining high-quality, reliable results."

Since 2007, PIT has evaluated over 270 technologies and operational practices during Energotest events it held in Canada. The tests have involved vehicles, including hybrid trucks, tractor and trailer aerodynamic devices, tires and wheel balancing systems, tarp systems for dump trailers, fuel, oil and gear lube additives, and alignment and tire pressure settings.

In recent months, PIT has worked to expand its offerings in the U.S. and is now providing verification services for electronic logging devices in accordance with FMCSA procedures.

During an Energotest, PIT uses the SAE J1321 testing method to evaluate technology's impact on fuel consumption, which it says provides the most accurate results.

“We measure fuel consumption on a track where every possible variable is controlled,” said Provencher. “The result is a fuel saving projection that is highly representative of what a fleet can expect to realize in actual over the road service. While we ...Read the rest of this story
Spot Truckload Freight Rates, Loads Ease Following November Gains

The amount of freight available to haul from the spot truckload market surged in November as rates generally moved higher, according to newly released figures from DAT Solutions and its network of load boards, while both slowed a little during the first full week in December.

After spiking the week before, the number of available loads on the spot truckload freight market edged down 9% for the week ending Dec. 10 compared to the previous seven days.

Spot freight volume remains higher than usual given the time of year, although load-to-truck ratios dipped across all three equipment types, according to DAT. The van load to truck ratio declined 28% from a 30-month high the week before, hitting 3.4 loads per truck. Reefers fell 25% to 6.1 loads per truck while flatbeds moved 6% lower to 17.7 loads per truck.

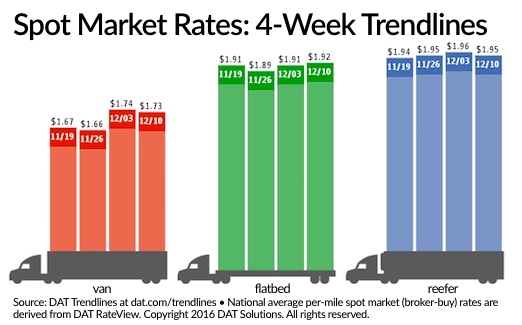
With volumes down and the number of posted trucks up 15% last week, national average van and refrigerated rates declined slightly. Vans fell 1 cent to $1.73 per mile, following an 8 cents increase last week, as reefers gave up 1 cent to $1.95 per mile. In contrast, flatbeds edged higher by 1 cent for an average of $1.92 per mile, its best showing in the last four weeks.

The rates include a fuel surcharge, which increased 1 cent on average after the national average price of on-highway diesel climbed another cent to $2.49 per gallon.

Last week, the number of van load posts fell 17% and truck posts increased 15% week over week. At $2.10 per mile, Los Angeles is the biggest van market where outbound rates are lower now than they were a month ago. Other key van lanes showed solid outbound rates for the season despite declines in some cases:

Denver, $1.38 per mile, up 10 centsChicago, $2.09 per mile, down 2 centsCharlotte, $1.98 ...Read the rest of this story

Trucking Helps For-Hire Freight Movements Bounce Back

<img width="150" src="http://www.automotive-fleet.com/fc_images/news/m-bts62-16-0-1.gif" border="0" alt="

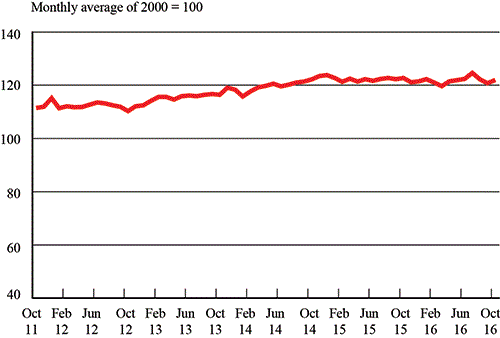
Freight Transportation Services Index, October 2011-October 2016. Graphic: U.S. DOT

" >

Freight Transportation Services Index, October 2011-October 2016. Graphic: U.S. DOT

" width="400">

The amount of for-hire freight moved in the U.S. increased following two months of declines, according to new Transportation Department figures.

Its Freight Transportation Services Index (TSI) rose 1% in October from September, the third largest hike since November 2014, putting the measure at 122, 2.1% below the all-time high level of 124.6 recorded this past July. Despite the improvement freight shipments fell 0.6% from October 2015.

The September index was revised downward to 120.8 from 121.5 in last month's release while monthly numbers for January through August remained virtually unchanged.

The Freight TSI measures the month-to-month changes in freight shipments by mode of transportation in tons and ton-miles, which are combined into one index. The index measures the output of the for-hire freight transportation industry and consists of data from for-hire trucking, rail, inland waterways, pipelines and air freight.

The improvement in the October Freight TSI from September was due to growth in trucking and rail intermodal, while all other modes declined, according to the department.

The October increase took place alongside growth in other economic indicators; employment increased by 161,000 jobs, retail sales increased by 0.8%, personal income increased by 0.6%, and housing starts rose by 25.5%. The Federal Reserve's measure of industrial production was unchanged in October as its mining and manufacturing components increased while utility output declined.

Since the beginning of 2015, the index has been extremely stable as it fluctuated above and below 122. It has deviated only twice by more than 1% from the 122 level, in March 2016 when it fell 1.9% below 122 to a two-year low, and in July 2016 when it rose 2.1% above 122 to reach an all-time high. The index has risen 28.8% since the historic low of 94.8 in April 2009.

Freight shipments measured ...Read the rest of this story