Bridge Report Finds Nearly 56,000 Bridges Still Need Attention
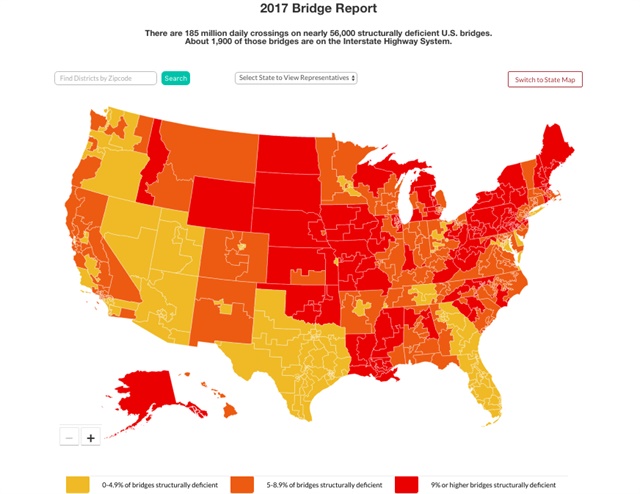
The American Road & Transportation Builders Association published an interactive map showing the states with the highest percentage of structurally deficient bridges. Source: ARTBA
">The American Road & Transportation Builders Association published an interactive map showing the states with the highest percentage of structurally deficient bridges. Source: ARTBA
">The U.S. Department of Transportation has released the 2016 National Bridge Inventory, which indicates that 55,710 bridges are structurally compromised-- including 13,000 that need replacement, widening, or major reconstruction.
The information was analyzed by the American Road & Transportation Builders Association. The information was compiled into ARTBA's 2017 Bridge Report.
The report is produced annually and by comparing 2016 to 2015's National Bridge Inventory, ARTBA found that progress has been slow in repairing bridges.
The inventory of structurally deficient bridges only decreased by 0.5% in a year's time. At that pace, it would take more than 20 years to address all of the problems structures.
“America's highway network is woefully underperforming. It is outdated, overused, underfunded and in desperate need of modernization,” said Alison Premo Black, chief economist of ARTBA. “State and local transportation departments haven't been provided the resources to keep pace with the nation's bridge needs.”
About 1,900 of the bridges are on the Interstate Highway System, affecting millions of Americans. The nation's cars, trucks, and buses cross the 55,710 bridges around 185 million times every day. While these bridges may not be imminently unsafe, their inclusion in the U.S. DOT report indicates that they are in need of attention.
The ARTBA report is presented through an interactive map of the United States, in which each state is color-coded based on the percentage of structurally deficient bridges it contains. By clicking on a state, a separate report on the state can be accessed, breaking down the breadth of the problem as well as the locations of each bridge.
Iowa was the state with the highest number of structurally deficient bridges at 4,968, while Rhode Island was the state with the highest percentage ...Read the rest of this story