Author: Vitaliy Dadalyan

Annual Ryder Technician Championship

The now 15-year old Ryder Top Technician Recognition Program, designed to identify, recognize, and reward Ryder's top performing truck maintenance technicians, held its annual competition at the Gaylord National Resort & Convention Center outside of Washington, D.C., last week. Eight finalists competed at the Washington D.C. event, which consisted of 10 hands-on skill tests that included vehicle electronics, preventive maintenance, and air conditioning – with a $50,000 winning purse and other prizes on the line. (All photos courtesy of Ryder)

A Different Approach to Fuel Efficiency Coaching

<img width="150" src="http://www.automotive-fleet.com/fc_images/articles/m-vnomics-1.jpg" border="0" alt="

Our test truck was a rented 2013 Volvo VNL. Vnomic's development test truck is in the background. Photo: Jim Park

">

Our test truck was a rented 2013 Volvo VNL. Vnomic's development test truck is in the background. Photo: Jim Park

">

Since you can't physically sit beside your drivers all day coaching their driving habits and performance, some sort of monitoring tool can be useful. However, if drivers see such devices as annoying or impeding their ability to drive, they won't happily accept the intrusion. A technology company in Pittsford, N.Y., has found a happy medium: a monitoring device that encourages drivers to do better without getting on their nerves or taking away drivability, while providing back-office data that helps fleets coach and instruct drivers on better driving habits to save fuel.

I recently paid a visit to Vnomics and saw how its engineers and developers had adopted the True Fuel technology from a military application. I also spent several hours in a test truck proving the system's ability to coax — rather than coerce — me into the green zone.

It's a simple system on the surface, with a huge amount of functionality built in.

The in-truck hardware consists of a reader that plugs into the truck's data port with a Y-cable (to keep the connection free for other applications such as electronic logs), and collects data on vehicle speed, power demand and engine operation. Each device is matched to the components on that particular truck. It reads sensor data from the ECU and sends it to the terminal in bursts via a cellular connection. There's no display to distract the driver; a tone is used to alert him or her to behavior that is problematic. The box is about the size of a paperback novel and it can be installed on or under the dash in less than 15 minutes.

I'll skip over the intricacies of the back-office software. Managers see only a very straightforward interface that shows driver performance and historical trends as well as current and previous trip data. In addition to evaluating driver performance. True Fuel can compare truck performance and fuel consumption information and identify underperforming or improperly spec'd trucks.

Much of what makes this work so well is how Vnomics interprets and displays the data. Embedded in the system architecture are the engine's fuel maps as well as the specs and ratings to aid in interpreting the data. Layered over that are driver and environmental information that the system uses to determine if the engine is being operated as efficiently as possible. For example, the system knows if the truck is 400 or 450 hp, whether it's empty or loaded, on flat ground or on a hill. That's all significant, as the driving technique might be different in each case.

It doesn't use fuel consumed as a driver-rating parameter, but rather potential fuel economy: Given where you are operating on the fuel map, how close did you come to using the least amount of fuel needed to generate the required power for operation? This immediately deflates any arguments about driver fuel economy rankings being unfair because they are subject to external influences. It's really about whether or not the driver is operating the truck correctly.

Ben Stevens, Vnomics' sales engineer, explains it this way. If one driver is getting 7.2 mpg out of an algorithm-determined potential of 7.5, he's within 4% of the target, which isn't bad. However, another driver might be getting 6.1 mpg out of a potential 6.2.

In testing Vnomics True Fuel, I made two runs over the same course, mostly stop-and-go driving with a little freeway time. We were bobtailing in a leased tractor with a manual transmission (the system works equally well on automated and automatic transmissions, too). I don't think the fact that we were bobtail matters, because again, the system was watching performance, not fuel consumed.

For the first run I put my bad driver hat on and deliberately drove as poorly as I could — hard braking, idling too much, taking gear changes to wildly high rpm, running in the wrong gear, etc. It was so against my nature to drive like this that I really had to work at it.

My score was a 46 out of a possible 100. I thought it would be much worse given how badly I was behaving. Stevens told me he has seen drivers with scores in the low 20s. I can't even imagine how badly you have to screw up to earn a score like that.

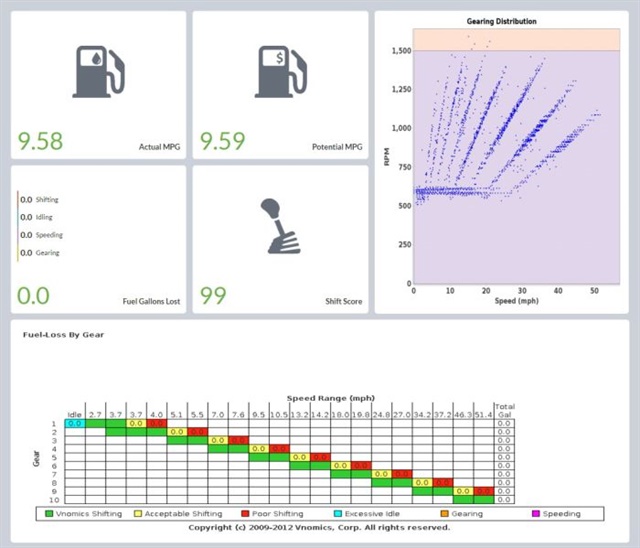
Run 2 was the Good Jim run. I diligently tried to keep the revs down, accelerate gently, minimize idling, skip gears, etc. I did pretty well, causing the alert to sound only three times for a score of 99.

Incidentally, each of the three times I messed up and over-revved a gear, I was talking to Ben. This was a real an eye-opener for me. The conversation distracted me from concentrating on my shifting. I can certainly drive properly when I'm thinking about it, but I could never maintain that level of concentration all day long.

And that may be the real benefit to True Fuel. A good, diligent driver gets a gentle alert from a not-unpleasant-sounding beep to remind him or her that they are slipping. That's a lot easier to take than finding out at the end of the month that you blew your fuel bonus.

VIDEO: Vnomics Test Drive Pt. 1- Bad Driver, Vnomics Test Drive Pt. 2 - Good Driver
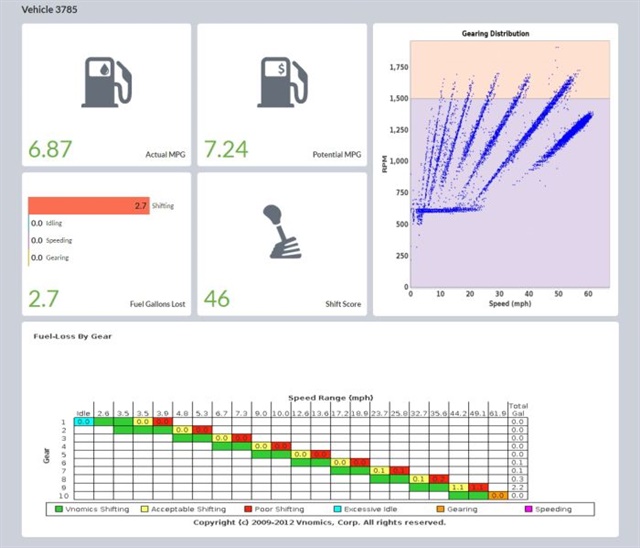
pstrongThe blue lines are a series of dots indicating my shift points. Also shown are actual and potential mpg as well as gallons wasted and my shift score. It's an easy-to-read representation of how well I was driving. The score is based on how close I came to my potential best fuel economy, not the actual mpg./strong Source: Vnomics/p

Follow @HDTrucking on Twitter

Average Diesel Prices Fall to $2.35 Per Gallon

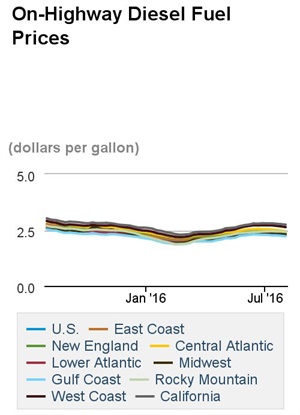
Diesel fuel prices are continuing to fall, dropping around 8 cents from their peak of $2.43 per gallon in early June, according to the latest numbers from the Energy Department.

The average price of a gallon of diesel fuel fell 3.1 cents last week, settling to $2.348 per gallon at the pump. While prices have been dropping, the gap between 2015's and 2016's prices has been shrinking. Last week's prices were 32 cents cheaper than in the same week a year ago.

When broken down by region, the largest decrease in prices occurred in the Central Atlantic, where prices fell by 4 cents. The smallest change was in the Rocky Mountain region where prices fell 1.5 cents.

Gas prices also fell last week with the average price of a gallon of regular gasoline dropping 2.3 cents to $2.159 per gallon. The price is 53 cents cheaper than it was for the same week of 2015.

The largest drop in prices was in the West Coast region, where it dropped 5.6 cents last week. The smallest change was a 0.3-cent drop in the Midwest.

The crude oil market has also been down in recent weeks, with the price of a barrel of crude dropping to around $40, according to a Market Watch report.

Crude oil prices had been on the rise since bottoming out earlier this year. But new fears that the global supply glut would not be going away has had a sobering effect on the oil market.

Global demand for oil has dropped in the past year. However, rather than limiting supply to adjust for weaker demand, OPEC members and other major oil-producing countries have resolved to increase production.

Related: Fuel Economy at Any Size

Follow @HDTrucking on Twitter

Dill Air Controls Offers Complete Truck Valve Installation Kit

Dill Air Controls has launched a complete truck valve installation toolkit, responding to feedback from fleets and service technicians.

Dill's research and development team worked with the trucking industry to figure out installation issues to gain an understanding of the common causes of valve stem air leaks. Dill designed the complete truck valve installation toolkit based on the results of its efforts.

“We were humbled by the support and feedback from major trucking companies as we worked to bring awareness to a problem as old as our industry can remember. The resulting toolkit enables any technician or servicing facility to clean, measure, and accurately torque valves to specifications as set forth by The Tire and Rim Association,” said Larry Schlesinger, Dill's chief engineer and tire and rim association tube and valve standards committee chair.

The toolkit includes a cleaning brush, Go/No-Go measuring tool, preset torque wrenches and a T-handle hex wrench to hold the base of the valve stem from spinning during tightening. Dill's 5720 kit is equipped to handle the variety of valves used in alloy and steel truck wheels.

Follow @HDTrucking on Twitter
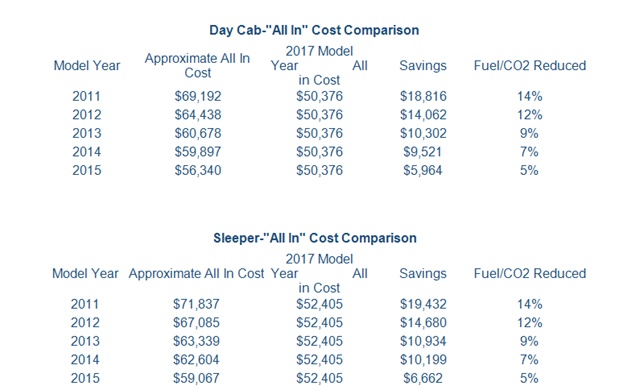
Lifecycle Index Shows Boost from Buying Latest Trucks

Fleet Advantage's quarterly Truck Lifecycle Data Index shows that in the second quarter of 2016, replacing 2011 model-year trucks with 2017 models will save fleets around $18,861 in the first 12 months of operation.

This is over $700 more in savings over the first quarter numbers, reflecting a 9% increase. Rising fuel prices over the past few months contributed to the increased savings realized by the more fuel efficient 2017 models.

While the biggest benefits are seen by replacing the older models, replacing a 2015 model-year day cab with a 2017 model will still net $5,964 in savings over 12 months. The savings calculations are based on an operation running 100,000 miles per year and were compiled from Fleet Advantage's' ATLAAS analytics software.

“It's clear that upgrading to a new truck provides significant benefits for fleet managers looking to strengthen their bottom line, and that fleets utilizing a shorter vehicle lifecycle will secure a competitive advantage.” said Brian McMahon, data analyst at Fleet Advantage. “First-year savings are impressive and rise exponentially when multiplied across dozens of truck units.”

The report also shows that fleets can see emissions and fuel usage reductions of 14% when replacing 2011 models with the latest trucks.

Related: Fleet Advantage Earns Technology Leadership Award

Follow @HDTrucking on Twitter

Accident Reporting App Guides Drivers Through the Process

The Accident Plan app is a mobile accident reporting application tool designed for the transportation industry that guides drivers through the accident reporting process while keeping administrators up to date in real time.

The app leads the driver step by step through the process and documents every vital aspect of the event, assembling it into a comprehensive accident report. The app also features an animated, seven-chapter training video that teaches drivers in advance about proper accident protocol and crash scene conduct.

“The motor carrier has long held the disadvantage when it comes to crash defense,” said Brendan Dawson, founder and CEO of Accident Plan. “That's due, at least in part, to the driver not having proper tools and training with which to adequately handle a stressful crash scene event.”

Accident Plan was built from scratch to give drivers a tool to help them focus on the task at hand and for motor carriers who need to proactively manage their claims. An annual subscription to Accident Plan costs $25 per driver. The app is available on the Apple App Store and Google Play store.

Follow @HDTrucking on Twitter

Economic Watch: Manufacturing Continues Rebound, Construction Lowest In a Year

After hitting a post-Great Recession low, economic activity in the nation's manufacturing sector continues to grow, but how strong that growth is depends on which report you read.

A survey of the nation's supply managers conducted by the Institute for Supply Management shows the manufacturing sector expanded for the firth straight month in July. Its Purchasing Managers Index hit 52.6%, just below Wall Street expectations.

While a reading above 50% indicates expansion, this is down from the June reading of 53.2%, meaning the pace last month was less robust.

Twelve of the 18 survey manufacturing industries reported an increase in new orders in July, the same as in June. Nine of the 18 industries reported an increase in production in July, down from 12 in June.

The New Orders Index registered 56.9%, a decrease of 0.1 of percentage point from the June reading. The Production Index registered 55.4%, 0.7 of a percentage point higher. The Employment Index registered 49.4%, a decrease of 1 percentage point from the June figure.

The overall reading moved into negative territory late last year, due in large part to an increase in the value of the U.S. dollar relative to other currencies, making export goods more expensive overseas. Also driving it down was the steep decline in oil prices for more than a year. After both stabilized this spring, the index increased but recently took a hit with the decision of voters in the U.K. last month to leave the European Union.

A separate but similar survey by the financial information services provider IHS Markit shows manufacturing output hit an eight-month high in July, with U.S. manufacturers signaling a relatively strong start to the third quarter of 2016.

Markit's Manufacturing Purchasing Managers' Index registered 52.9 in July, up from 51.3 in the previous month and comfortably above the post-crisis low seen in May of 50.7. This final PMI reading for July was unchanged from the earlier preliminary figure. A survey reading above 50 indicates expansion.

“The stronger manufacturing PMI survey data for July fuel hopes that the sector will act as less of drag on the economy in the third quarter after a disappointing first half of the year,” said Chris Williamson, chief economist at Markit.

Markit's July data shows a sustained rebound in production volumes across the manufacturing sector. Higher levels of output have been recorded in each of the past two months, with the latest expansion the fastest since November 2015, according to the report. Anecdotal evidence cited greater inflows of new work and supportive economic conditions.

“Having signaled the sector's worst performance for over six years in the second quarter, contributing to a sluggishness in the economy that was later seen in the soft gross domestic product numbers, the improvement in July suggests that manufacturers and exporters will have helped lift the economy at the start of the third quarter," Markit notes.

Construction Spending Falls For Third Straight Month

These reports follow a separate one released Monday by the Commerce Department showing total construction spending fell in June by 0.6% from the revised rate the month before, hitting its lowest level in a year.

The level is still 0.3% higher than June 2015, and construction spending in the first half of 2016 is 6.2% better than it was during the first six months of last year.

A 0.6% decline in spending for private construction pulled down the overall June figure, while residential construction was nearly the same as it was the month before. A 0.6% drop in public construction projects also led to the overall decline that includes a 1.4% drop in highway construction.

The drop in the overall construction spending could pull down revised second quarter GDP numbers when they are released in about a month, following a report issued Friday showing overall economic activity in the U.S. grew at a rate of 1.2% in the second quarter, better than the first quarter rate, but far off what many analysts were expecting.

Follow @HDTrucking on Twitter