Travel Advisories in Affect as Hurricane Harvey Nears Texas
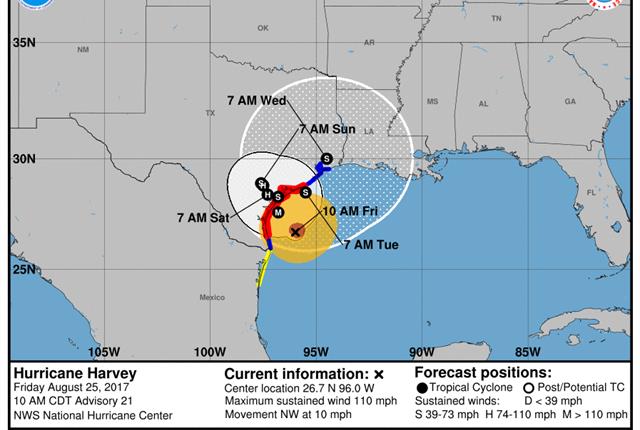
The National Hurricane Center is advising against all but essential local travel on roadways affected by Hurricane Harvey. Photo: National Hurricane Center
">The National Hurricane Center is advising against all but essential local travel on roadways affected by Hurricane Harvey. Photo: National Hurricane Center
">A dangerous hurricane has prompted both state and federal authorities to issue a variety of travel warnings and advisories that will definitely impact and disrupt trucking operations along with Louisiana and Texas coast for the next several days.
Latest reports say Hurricane Harvey is a Category 2 storm, with the potential to reach Category 3 by the time it makes landfall. According to the National Hurricane Center, Category 3 hurricanes have great potential for structural damage as far away as 25 miles from the eye of the storm. Meteorologists say the storm could dump as much as 30 inches of rain on affected areas. Sustained winds of 111 mph are also possible.
Drivers in the storm's footprint should also be aware of the potential for severe flooding, says the Texas Department of Transportation. The agency says that the heavy rainfall, combined with storm surges up to 5 feet, will cause dangerous flood situations on roadways along the coast and is urging drivers to exercise caution and simply turn around when confronted with submerged roadways.
Currently, Texas DOT says the state is prepared and storm response rescue and maintenance crews are positioned and ready to go once the full brunt of the storm hits the coastline. As of 10 a.m. Central time Friday morning, the agency was advising drivers to suspend all non-essential local travel in areas affected by the storm.
For up-to-date information on conditions and travel advisories in areas affected by Hurricane Harvey, follow the TxDOT Ferry Twitter feeds, @GalvestonFerry and @PortA_Ferry, as well as @TxDOT_CRP.
Additional updates can be found on DriveTexas.org and on Facebook, www.facebook.com/txdot and Twitter, www.twitter.com/txdot.
Follow @HDTrucking on Twitter
...Read the rest of this story